A Deep Dive into SRE Tools for Digital Domination
Ready to dive into the wild world of Site Reliability Engineering (SRE) and unlock the secrets behind keeping your digital kingdom standing tall and proud? Well, buckle up, because we’re about to embark on a tool-tastic journey that’s going to revolutionize the way you think about reliability!
In this blog post, we’re not just going to talk shop about SRE — we’re going to get our hands dirty with the coolest tools in the SRE arsenal. You know, those magical bits and bytes that make sure your site stays up and running, no matter what the internet throws at it.
Monitoring and Alerting SRE Tools
Prometheus
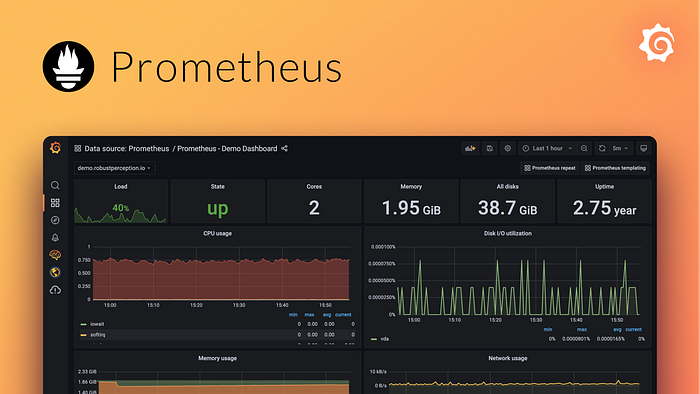
Prometheus, the unsung hero of monitoring, is not your average tool — it’s the beating heart of Site Reliability Engineering (SRE). At its core, Prometheus is an open-source systems monitoring and alerting toolkit designed for reliability and scalability.

Key Features:
- Multi-Dimensional Data Model: Prometheus embraces a powerful data model, allowing you to slice, dice, and analyze data from various angles.
- Flexible Query Language (PromQL): Dive deep into your metrics with PromQL, a language tailored for extracting meaningful insights.
- Scalability: Prometheus is built to handle the dynamic nature of modern, containerized environments, ensuring it grows with your infrastructure.
Use Cases in SRE
Prometheus shines bright in the SRE galaxy, playing a pivotal role in ensuring system reliability and performance. Here’s how it earns its stripes:
- Incident Detection and Response: With real-time monitoring, Prometheus acts as a vigilant sentinel, detecting anomalies and triggering alerts when things go south.
- Performance Analysis: Dive into historical data and trends to identify performance bottlenecks, enabling proactive optimization.
- Capacity Planning: Prometheus provides the ammunition for intelligent capacity planning, ensuring your system is always prepared for the next surge in traffic.
Integration with Other Tools
Prometheus isn’t a lone wolf; it dances seamlessly with other tools in the SRE toolkit:
- Grafana Integration: Combine Prometheus with Grafana for stunning visualizations and dashboards that turn raw data into actionable insights.
- Alertmanager Collaboration: Working hand-in-hand with Alertmanager, Prometheus ensures that the right people are notified promptly when incidents occur.
- Kubernetes Harmony: Prometheus is a natural fit in Kubernetes environments, offering native support and effortlessly adapting to the dynamic nature of container orchestration.
In the symphony of SRE tools, Prometheus takes the stage, conducting a melody of reliability and performance. Embrace its power, and you’ll be well on your way to mastering the art of Site Reliability Engineering.
Incident Management SRE Tools
PagerDuty
In the high-stakes game of Site Reliability Engineering (SRE), PagerDuty is the maestro orchestrating real-time incident response. Picture it as your digital 911, ready to spring into action when the bits hit the fan.

Swift Action: PagerDuty ensures that when an incident occurs, the response is immediate. No more waiting in the dark — PagerDuty lights the way to resolution.
On-Call Rotations: With PagerDuty, the on-call concept becomes a well-choreographed dance. Team members take turns being the hero on call, ensuring 24/7 vigilance without burning out your SRE warriors.
Escalation Policies
PagerDuty is not just about the first responder; it’s about the entire cavalry riding to the rescue. Escalation policies are the secret sauce that ensures incidents reach the right hands at the right time.
Intelligent Escalation: Define escalation paths based on the severity of the incident. PagerDuty knows who to alert first, and if they’re busy enjoying a coffee break, it seamlessly moves down the line until someone takes charge.
Customization:* Tailor escalation policies to your team’s unique needs. Whether it’s a critical outage or a minor hiccup, PagerDuty ensures the appropriate response every time.
Integrations with Monitoring Tools
PagerDuty doesn’t toil alone; it’s a team player that syncs effortlessly with your monitoring tools to create a harmony of detection and response.
Seamless Integration: PagerDuty hooks up with monitoring tools like Prometheus and Grafana, transforming raw metrics into actionable alerts.
Bi-Directional Communication: The integration is not a one-way street. PagerDuty provides feedback to monitoring tools, closing the loop on incidents and enabling continuous improvement.
Rich Notifications: PagerDuty doesn’t just shout “Houston, we have a problem.” It delivers rich notifications with context, empowering your SREs to hit the ground running when an incident arises.
In the grand SRE opera, PagerDuty takes center stage, ensuring that incidents are not just managed but conquered with finesse. So, when the digital battlefield heats up, PagerDuty stands ready to lead your SRE forces to victory.
Deployment and Configuration Management Tools
Kubernetes
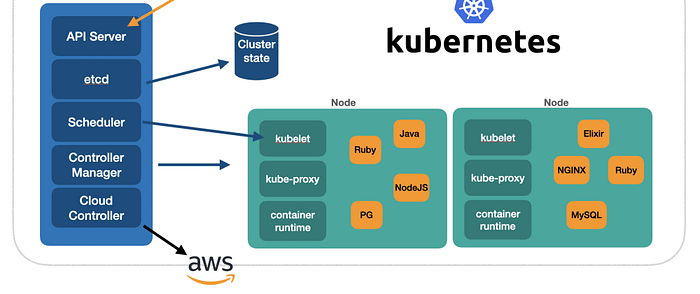
In the ever-evolving landscape of Site Reliability Engineering (SRE), Kubernetes emerges as the heavyweight champion of container orchestration. Its mission? To turn the chaos of deploying and managing containers into a symphony of reliability.

Container Harmony: Kubernetes brings order to the containerized world, ensuring applications run seamlessly across diverse environments. It’s the conductor that turns individual containers into a well-coordinated ensemble.
Service Discovery: Kubernetes excels at discovering and connecting services, providing a reliable foundation for microservices architecture. No more guessing games — Kubernetes knows where each service resides.
Rolling Updates and Rollbacks
The show must go on, even during updates. Kubernetes introduces a dazzling act: rolling updates and rollbacks, ensuring continuous delivery without missing a beat.
Rolling Updates: Say goodbye to downtime. Kubernetes orchestrates updates gracefully, gradually shifting traffic to new versions while gracefully retiring the old ones. Your users won’t even notice the change.
Effortless Rollbacks: Sometimes, the best-laid plans encounter unexpected hiccups. Kubernetes allows you to roll back to a previous version with ease, mitigating risks and ensuring a smooth user experience.
Auto-Scaling and Self-Healing
Kubernetes isn’t just about deployment; it’s about adapting to the ebb and flow of demand. Enter auto-scaling and self-healing, the dynamic duo of reliability.
Auto-Scaling Magic: Kubernetes monitors your application’s resource usage and automatically adjusts the number of running instances to handle varying workloads. Scale up when it’s bustling, scale down when it’s chill.
Self-Healing Capabilities: Kubernetes takes a proactive stance on system health. If a container or node fails, Kubernetes swiftly replaces it, ensuring your application’s resilience in the face of unforeseen challenges.
In the grand theater of SRE, Kubernetes steals the spotlight, demonstrating that deployment and configuration management can be not just efficient but truly spectacular. So, whether you’re orchestrating a massive production or fine-tuning a small ensemble, Kubernetes is your backstage pass to a world of reliability.
Logging and Tracing Tools
ELK Stack (Elasticsearch, Logstash, Kibana)
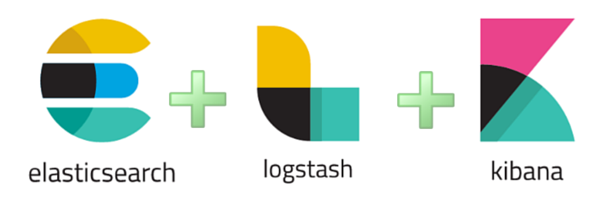
Enter the ELK Stack, the trio that turns logs from scattered whispers into a unified symphony. Elasticsearch, the heartbeat of the operation, stores logs centrally, bringing order to the chaos of distributed systems.

Unified Repository: ELK Stack consolidates logs from various sources, creating a single source of truth. No more hunting through scattered logs; everything you need is in one place.
Scalability: As your digital empire expands, Elasticsearch scales horizontally, accommodating the ever-growing volume of logs without breaking a sweat.
Log Analysis and Search Capabilities
ELK Stack isn’t just about storage; it’s about transforming raw logs into actionable insights. Logstash, the interpreter, filters and structures the data, while Elasticsearch offers lightning-fast search capabilities.
Real-time Analysis: Logstash dissects and organizes log entries, allowing for real-time analysis. Identify trends, anomalies, and potential issues before they snowball into bigger problems.
Flexible Query Language: Elasticsearch’s powerful query language lets you drill down into the nitty-gritty details. Whether it’s a specific timestamp or a unique identifier, finding what you need is a breeze.
Correlation with Other Monitoring Data
In the world of SRE, correlation is key. Kibana, the visual storyteller of the ELK Stack, takes logs to the next level by intertwining them with other monitoring data.
Unified Dashboards: Kibana crafts visually stunning dashboards that marry log data with metrics from tools like Prometheus and Grafana. It’s a holistic view that provides context to incidents.
Cross-Tool Correlation: ELK Stack isn’t an isolated performer. It collaborates seamlessly with monitoring tools, creating a synergy that allows you to connect the dots between logs and other observability data.
In the SRE theater of operations, ELK Stack is the backstage crew that ensures every log has its moment in the spotlight. From centralized storage to real-time analysis, ELK Stack is your ticket to understanding the narrative of your system and keeping your digital drama glitch-free.
Automation and Scripting SRE Tools
Ansible
Enter Ansible, the unsung hero of the automation realm in Site Reliability Engineering (SRE). Ansible doesn’t just automate; it orchestrates the symphony of server configurations with finesse.
Agentless Wonder:* Ansible works its magic without the need for agents on managed nodes. It communicates over SSH, making it lightweight and ensuring simplicity in setup.
Infrastructure as Code (IaC): Ansible embraces the Infrastructure as Code philosophy, enabling you to define and manage your infrastructure in a version-controlled, repeatable manner.
Playbooks for Repetitive Tasks
Think of Ansible playbooks as the scripts of your reliability opera. These YAML files describe the steps of your automation performance, turning mundane tasks into a well-choreographed routine.
Declarative Language:* With a declarative approach, Ansible playbooks express the desired state of the system, allowing for idempotent and predictable configurations.
Reusability:* Playbooks are not one-hit wonders. Once crafted, they become reusable assets, reducing manual intervention and ensuring consistency across environments.
Ensuring Consistency in Server Configurations
Consistency is the backbone of reliability, and Ansible is your trusty guide in maintaining uniformity across the server landscape.
Idempotency in Action: Ansible ensures that running a playbook multiple times produces the same result, avoiding unintended configuration drifts and guaranteeing consistency.
Rollback Capabilities: When changes are inevitable, Ansible allows you to roll back to a known good state swiftly, mitigating risks and minimizing the impact of unforeseen challenges.
In the world of SRE, Ansible takes center stage as the maestro orchestrating the automation symphony. From configuration management to ensuring repeatability, Ansible is the key to a harmonious infrastructure where consistency and efficiency reign supreme. So, sit back, relax, and let Ansible conduct the automation opera for your SRE endeavors.
Best Practices for SRE Tooling

1. Ensuring Seamless Communication Between Tools
In the SRE landscape, tools don’t work in isolation; they perform a synchronized dance. Seamless communication is the backbone of a reliable system, and integration ensures that each tool is not just a soloist but part of a well-orchestrated ensemble.
API Harmony: Leverage well-documented APIs to facilitate smooth communication between tools. Ensure that each tool can effortlessly share and receive data, fostering a collaborative environment.
Event-driven Collaboration: Implement event-driven architectures to enable tools to react to incidents and changes in real time. This ensures that the entire toolchain is in sync and responds promptly to evolving scenarios.
2. Data Consistency Across the SRE Ecosystem
Data is the lifeblood of SRE, and maintaining consistency across the entire ecosystem is paramount. Inconsistencies can lead to confusion and hinder effective decision-making.
Common Data Standards: Establish and adhere to common data standards across tools. Whether it’s metrics, logs, or alerts, a standardized format ensures a shared language and facilitates meaningful correlations.
Periodic Audits: Conduct regular audits to ensure data consistency. Verify that each tool is interpreting and displaying data consistently, minimizing the risk of misinterpretations during incident resolution.
3. Common Pitfalls and How to Avoid Them
The path to SRE excellence is not without its pitfalls. Recognizing and sidestepping these common challenges ensures a smoother journey.
Tool Sprawl: Be mindful of tool sprawl — the proliferation of tools without a clear purpose. Consolidate your toolset to avoid complexity and ensure that each tool serves a distinct, valuable role.
Lack of Documentation: Thoroughly document integrations, workflows, and configurations. Clear documentation ensures that team members can easily understand and contribute to the tooling ecosystem.
Failure to Evolve: The SRE landscape evolves rapidly. Regularly assess and update your toolset to incorporate the latest advancements, ensuring that your SRE practices remain cutting-edge.
In the realm of SRE tooling, cross-tool integration isn’t just a convenience — it’s a necessity. By fostering seamless communication, maintaining data consistency, and navigating common pitfalls, your SRE toolchain becomes a well-tuned orchestra, producing the harmonious results of a reliable and resilient system.
